A country’s transition to a green economy can be guided by identifying, supporting, and engaging the organisations that have a greater potential to improve the environmental performance of the economy. Such organisations are known as sensitive intervention points (SIPs)1 and they can be critical tipping points in achieving climate goals.
An organisation might be a SIP because it contributes significantly to the green performance of the economy, is widely recognised as an exemplar of socially-conscious action, is a recognised thought leader and/or trusted voice, plays a strong role in influencing the actions of organisations throughout the country, is an intermediary for action between government policies and the private sector, or has a large pool of resources to devote to fostering the green economy.
This article uses macroeconomic analysis, Input-Output modelling, and recent data on carbon emissions and the UAE’s economy, to identify SIPs in the UAE. While the focus here is on carbon, the methodology could be applied to any environmental measure, such as water use or habitat protection.
Macroeconomics and Input-Output tables
Whereas microeconomics focuses on the economic decisions of individuals or organisations, macroeconomics recognises that different economic sectors are linked and that changes in one can influence others that are part of the same production chain. This linkage can improve or worsen the economic environmental performance of the economy overall.
A country builds its macroeconomic models around Input-Output tables, which describe the sale and purchase relationships between producers and consumers in an economy. For example, in a production chain for business, the output of goods and services from one sector (a selling sector) becomes input for another sector (a purchasing sector), which then uses the inputs to create outputs of goods and services (becoming a selling sector). These often complex transactions, which include imports and exports, are called ‘intermediate consumption’ or ‘intermediate production’.
Once a product is fully assembled, it is sold on for ‘final consumption’ such as to a household or government. The household or government does not then provide any further output into the economy, although it may require inputs, such as when a household uses electricity to power the television it purchased.
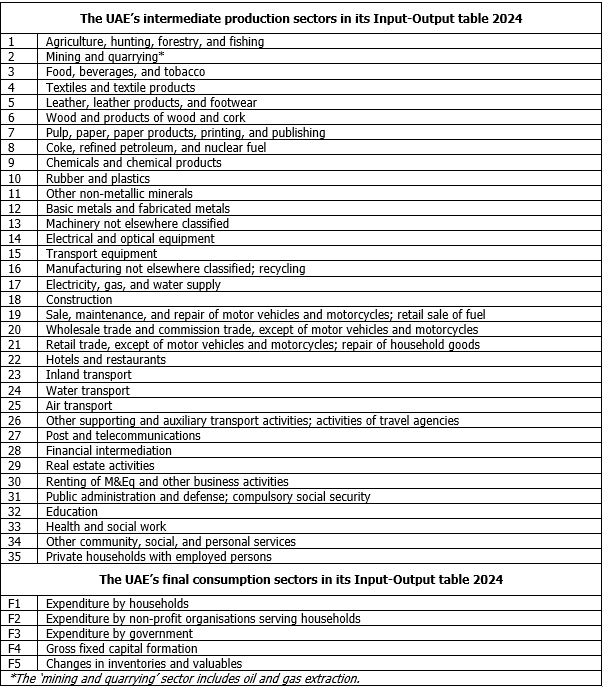
The UAE’s Input-Output table for 2024, held by the Asian Development Bank3, is the most recent available and contains 35 intermediate production sectors and five final consumption sectors.
Economic metrics: Contribution to GVA and GDP
These sectors buy goods and services from other sectors and sell newly assembled goods and services on to others. In doing so, they create ‘value added’ which can go towards paying the workforce, investing in new facilities, paying taxes, etc. This value added is what is used to calculate a country’s gross value added (GVA) and therefore gross domestic product (GDP).
Figure 1: Contribution of the UAE’s intermediate production sectors
to GVA 2024 (in USD millions)
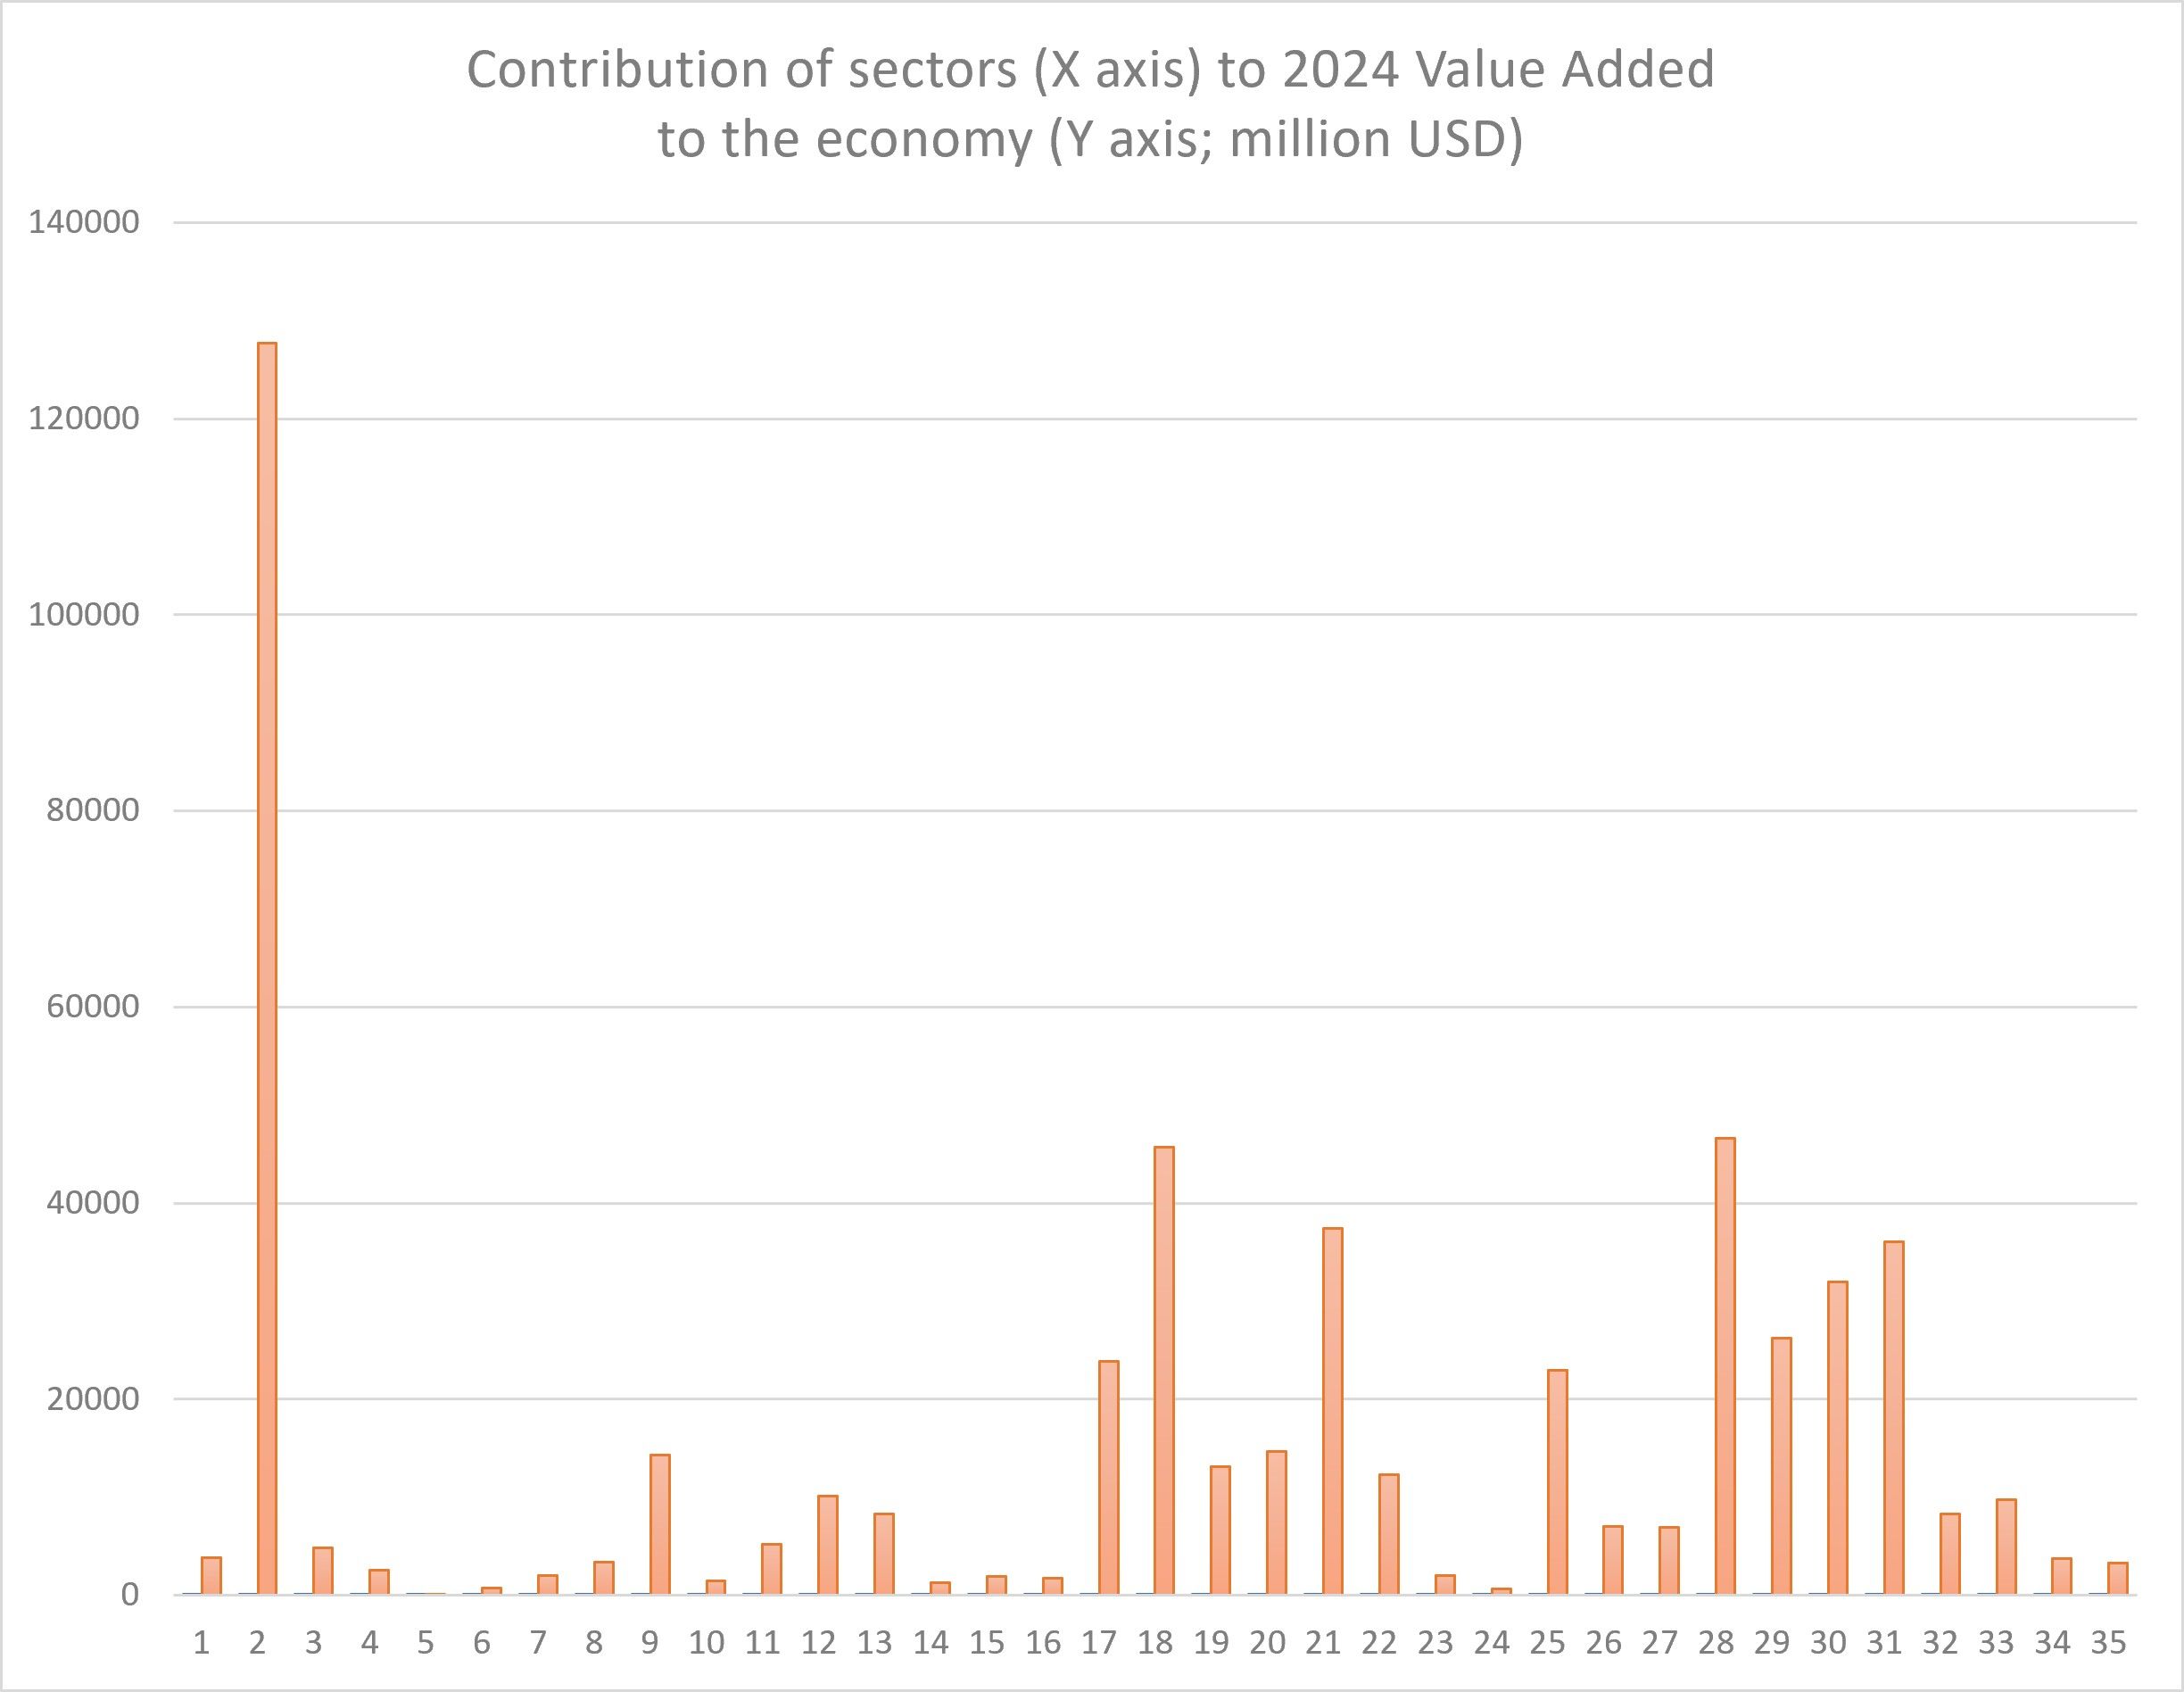
Sector 2 (mining and quarrying) is dominant in producing GVA for the UAE due to that sector encompassing the extraction of oil and gas, a major component of the country’s current economy. This is followed by sectors 18 (construction) and 28 (financial intermediation).
Figure 2: Total value of the purchases of goods and services
in the UAE 2024 (in USD millions)
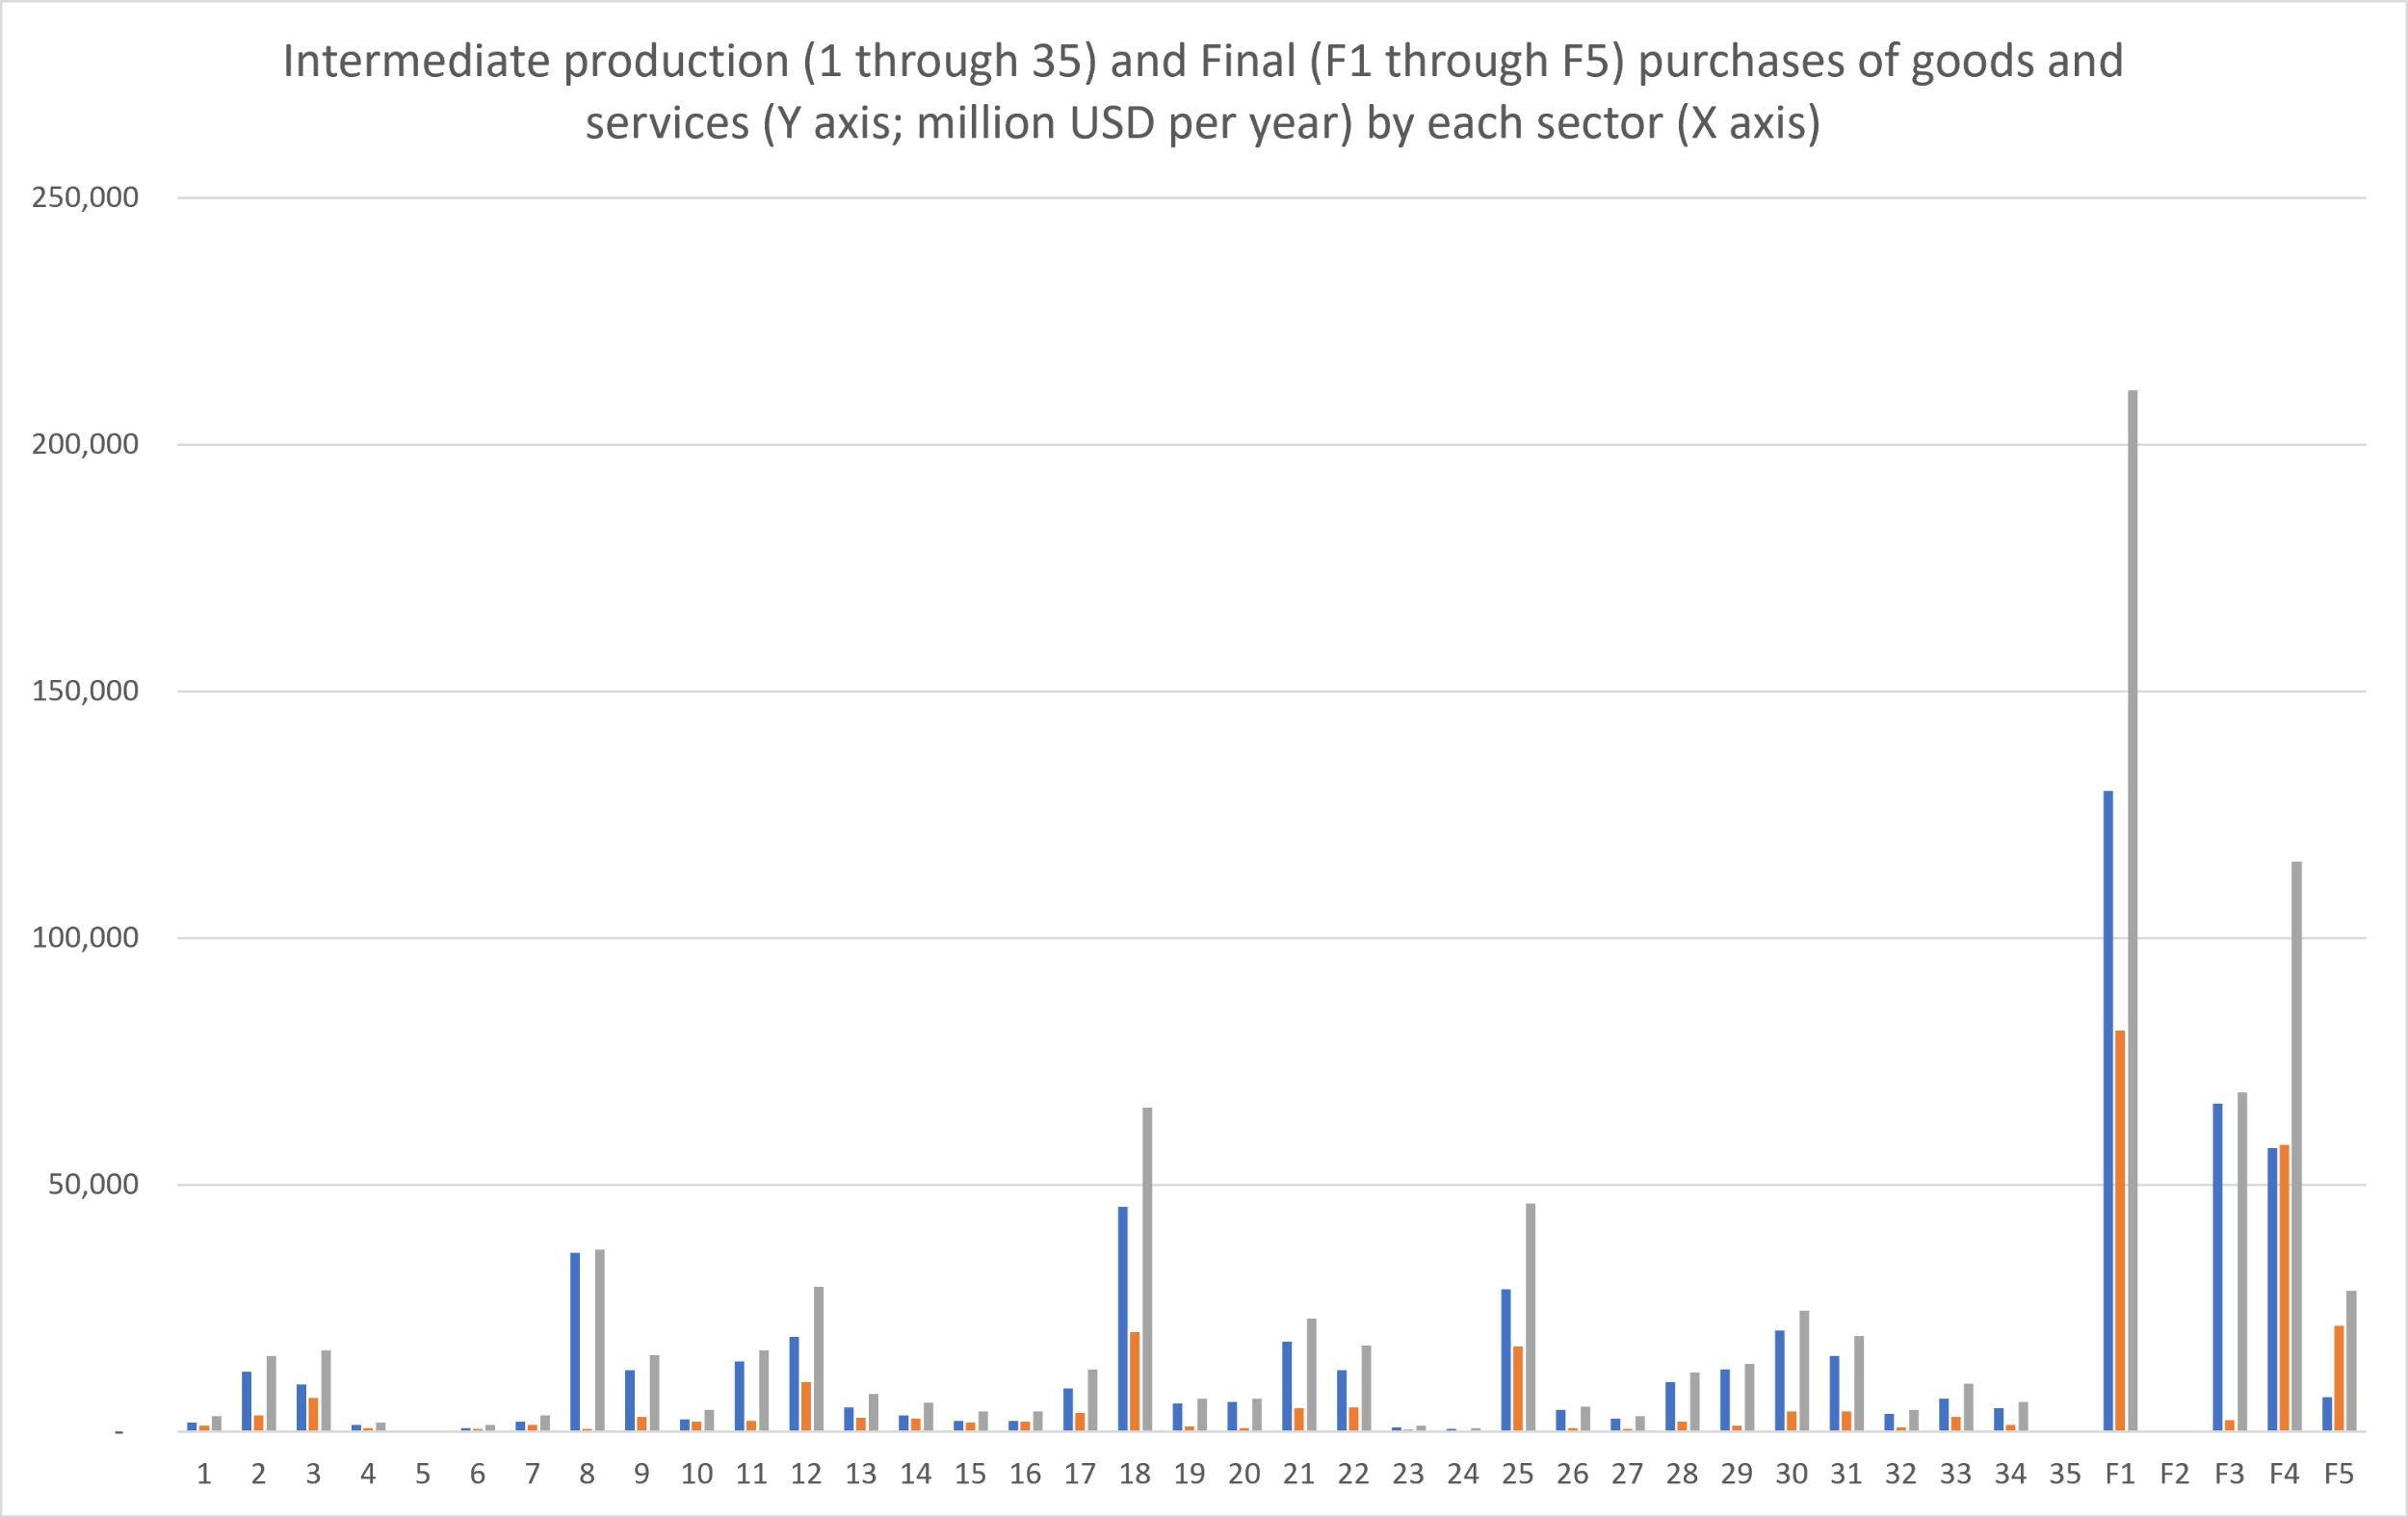
Left blue bar: Goods and services produced and purchased in the UAE
Middle orange bar: Goods and services purchased through imports
Right grey bar: Total purchases
However, a sector might contribute strongly to GVA but be much less significant as a source of purchases because while it generates value, it does not need to buy many goods or services to carry out its economic activity and it does not sell its goods or services on to other sectors. In the UAE, sector 2 (mining and quarrying) is a good example of this, as most of the economic activity in that sector comes from selling oil and gas on the world market through exports.
Final consumption sectors dominate as a source of purchases, so while production-based policies are important in considering environmental impacts, they must be paired with equally ambitious consumption-based policies.
The impact on carbon emissions and climate change of all purchases of goods and services within the UAE’s economy can be related most strongly to energy purchases from sector 17 (electricity, gas, and water supply) and sectors 23, 24, and 25 (inland, water, and air transport, including fuel purchases).
Figure 3: Value of the purchases of goods and services
in the UAE for energy-related consumption 2024 (in USD millions)
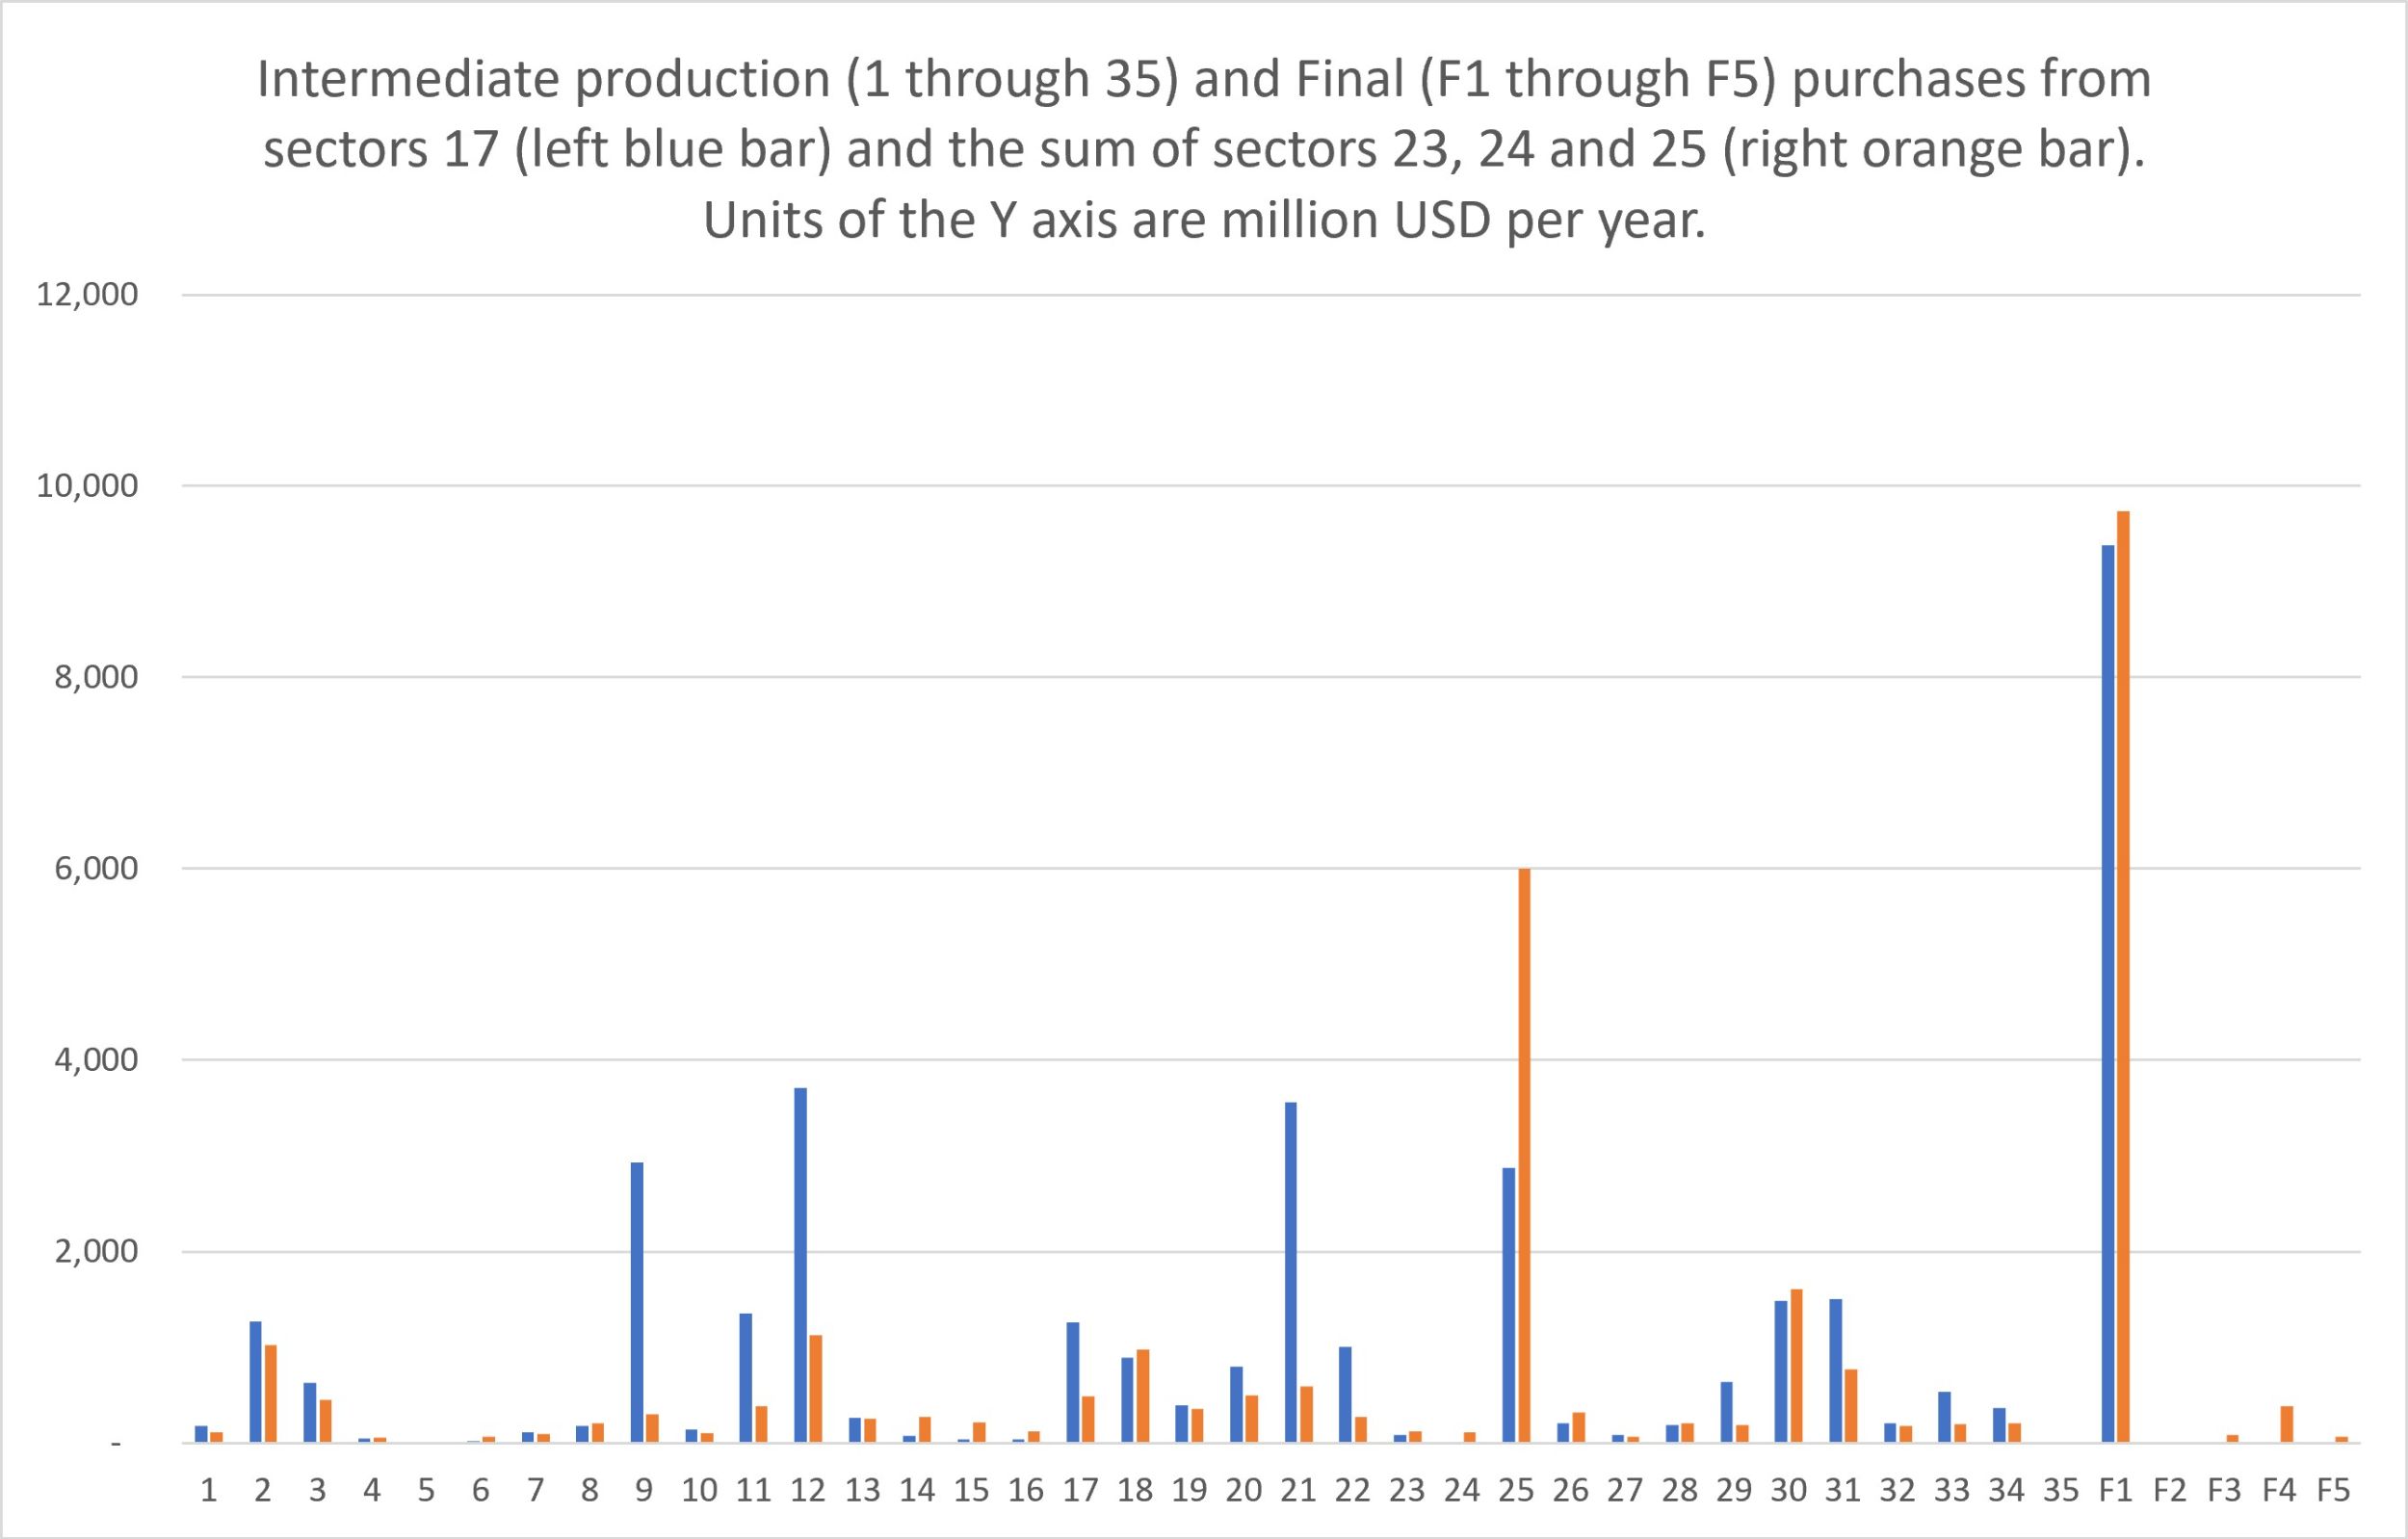
Blue bar: Purchases from sector 17 (electricity, gas and water supply) only.
Orange bar: Sum of purchases from sectors 23, 24 and 25 (inland, water and air transport) only.
F1, final consumption expenditure by households, is an important energy purchaser due to its use of electricity, water, and transport. This is followed by sector 25 (air transport), with most of its intermediate production activity being through imports. Other significant contributors are sectors 9 (chemicals and chemical products), 11 (other non-metallic minerals), and 21 (retail trade).
These figures provide the basis for examining the relative economic impact of intermediate production and final consumption sectors within the economy, but they do not reflect their potential environmental impact. For that we need two proxy calculations.
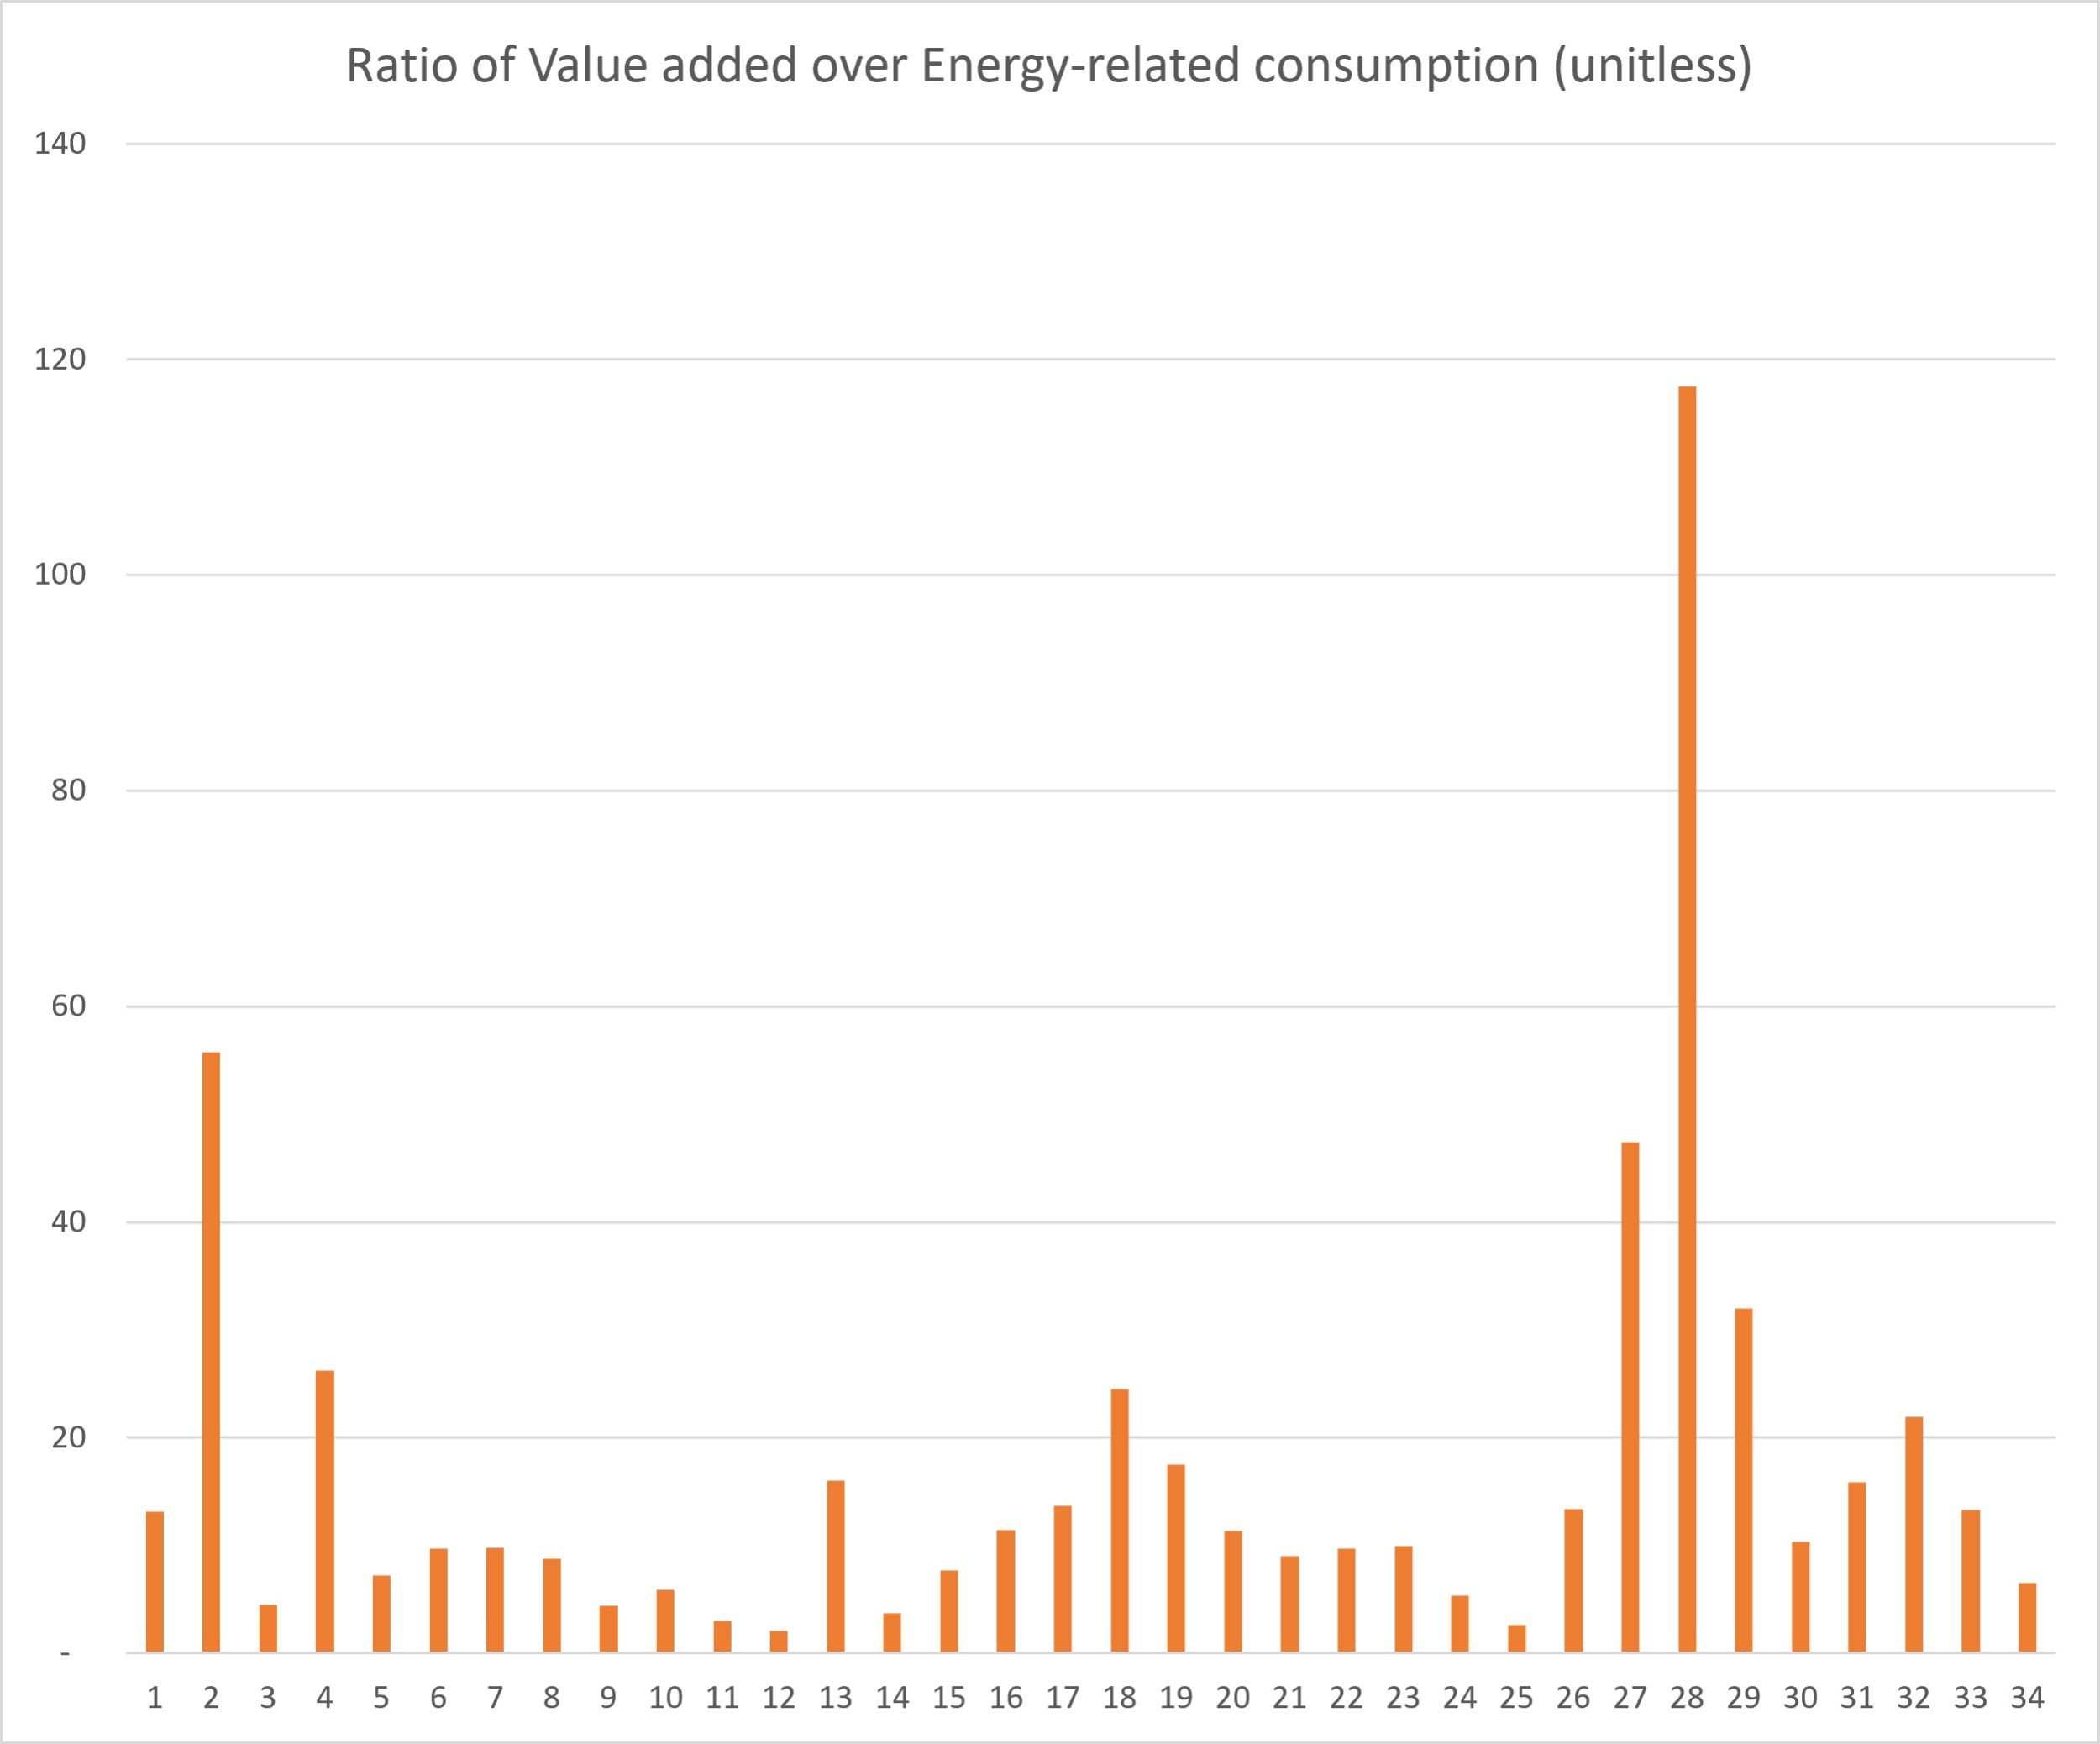
If we calculate the ratio of a sector’s energy-related intermediate consumption over its GVA, a high value suggests that production-based policies are needed to encourage that sector to reduce its consumption of material and/or energy per unit of GVA through behaviour change and greater efficiency. However, if we calculate the ratio of GVA over energy-related intermediate consumption, a high value suggests that sector is very efficient at producing value for each unit of environmental impact. Policies should emphasise these sectors as part of the economy.
Figure 4: Ratio of energy-related intermediate consumption over GVA by sector. A higher ratio means a sector consumes more of sectors 17, 23, 24, and 25 per unit of value added to the economy.
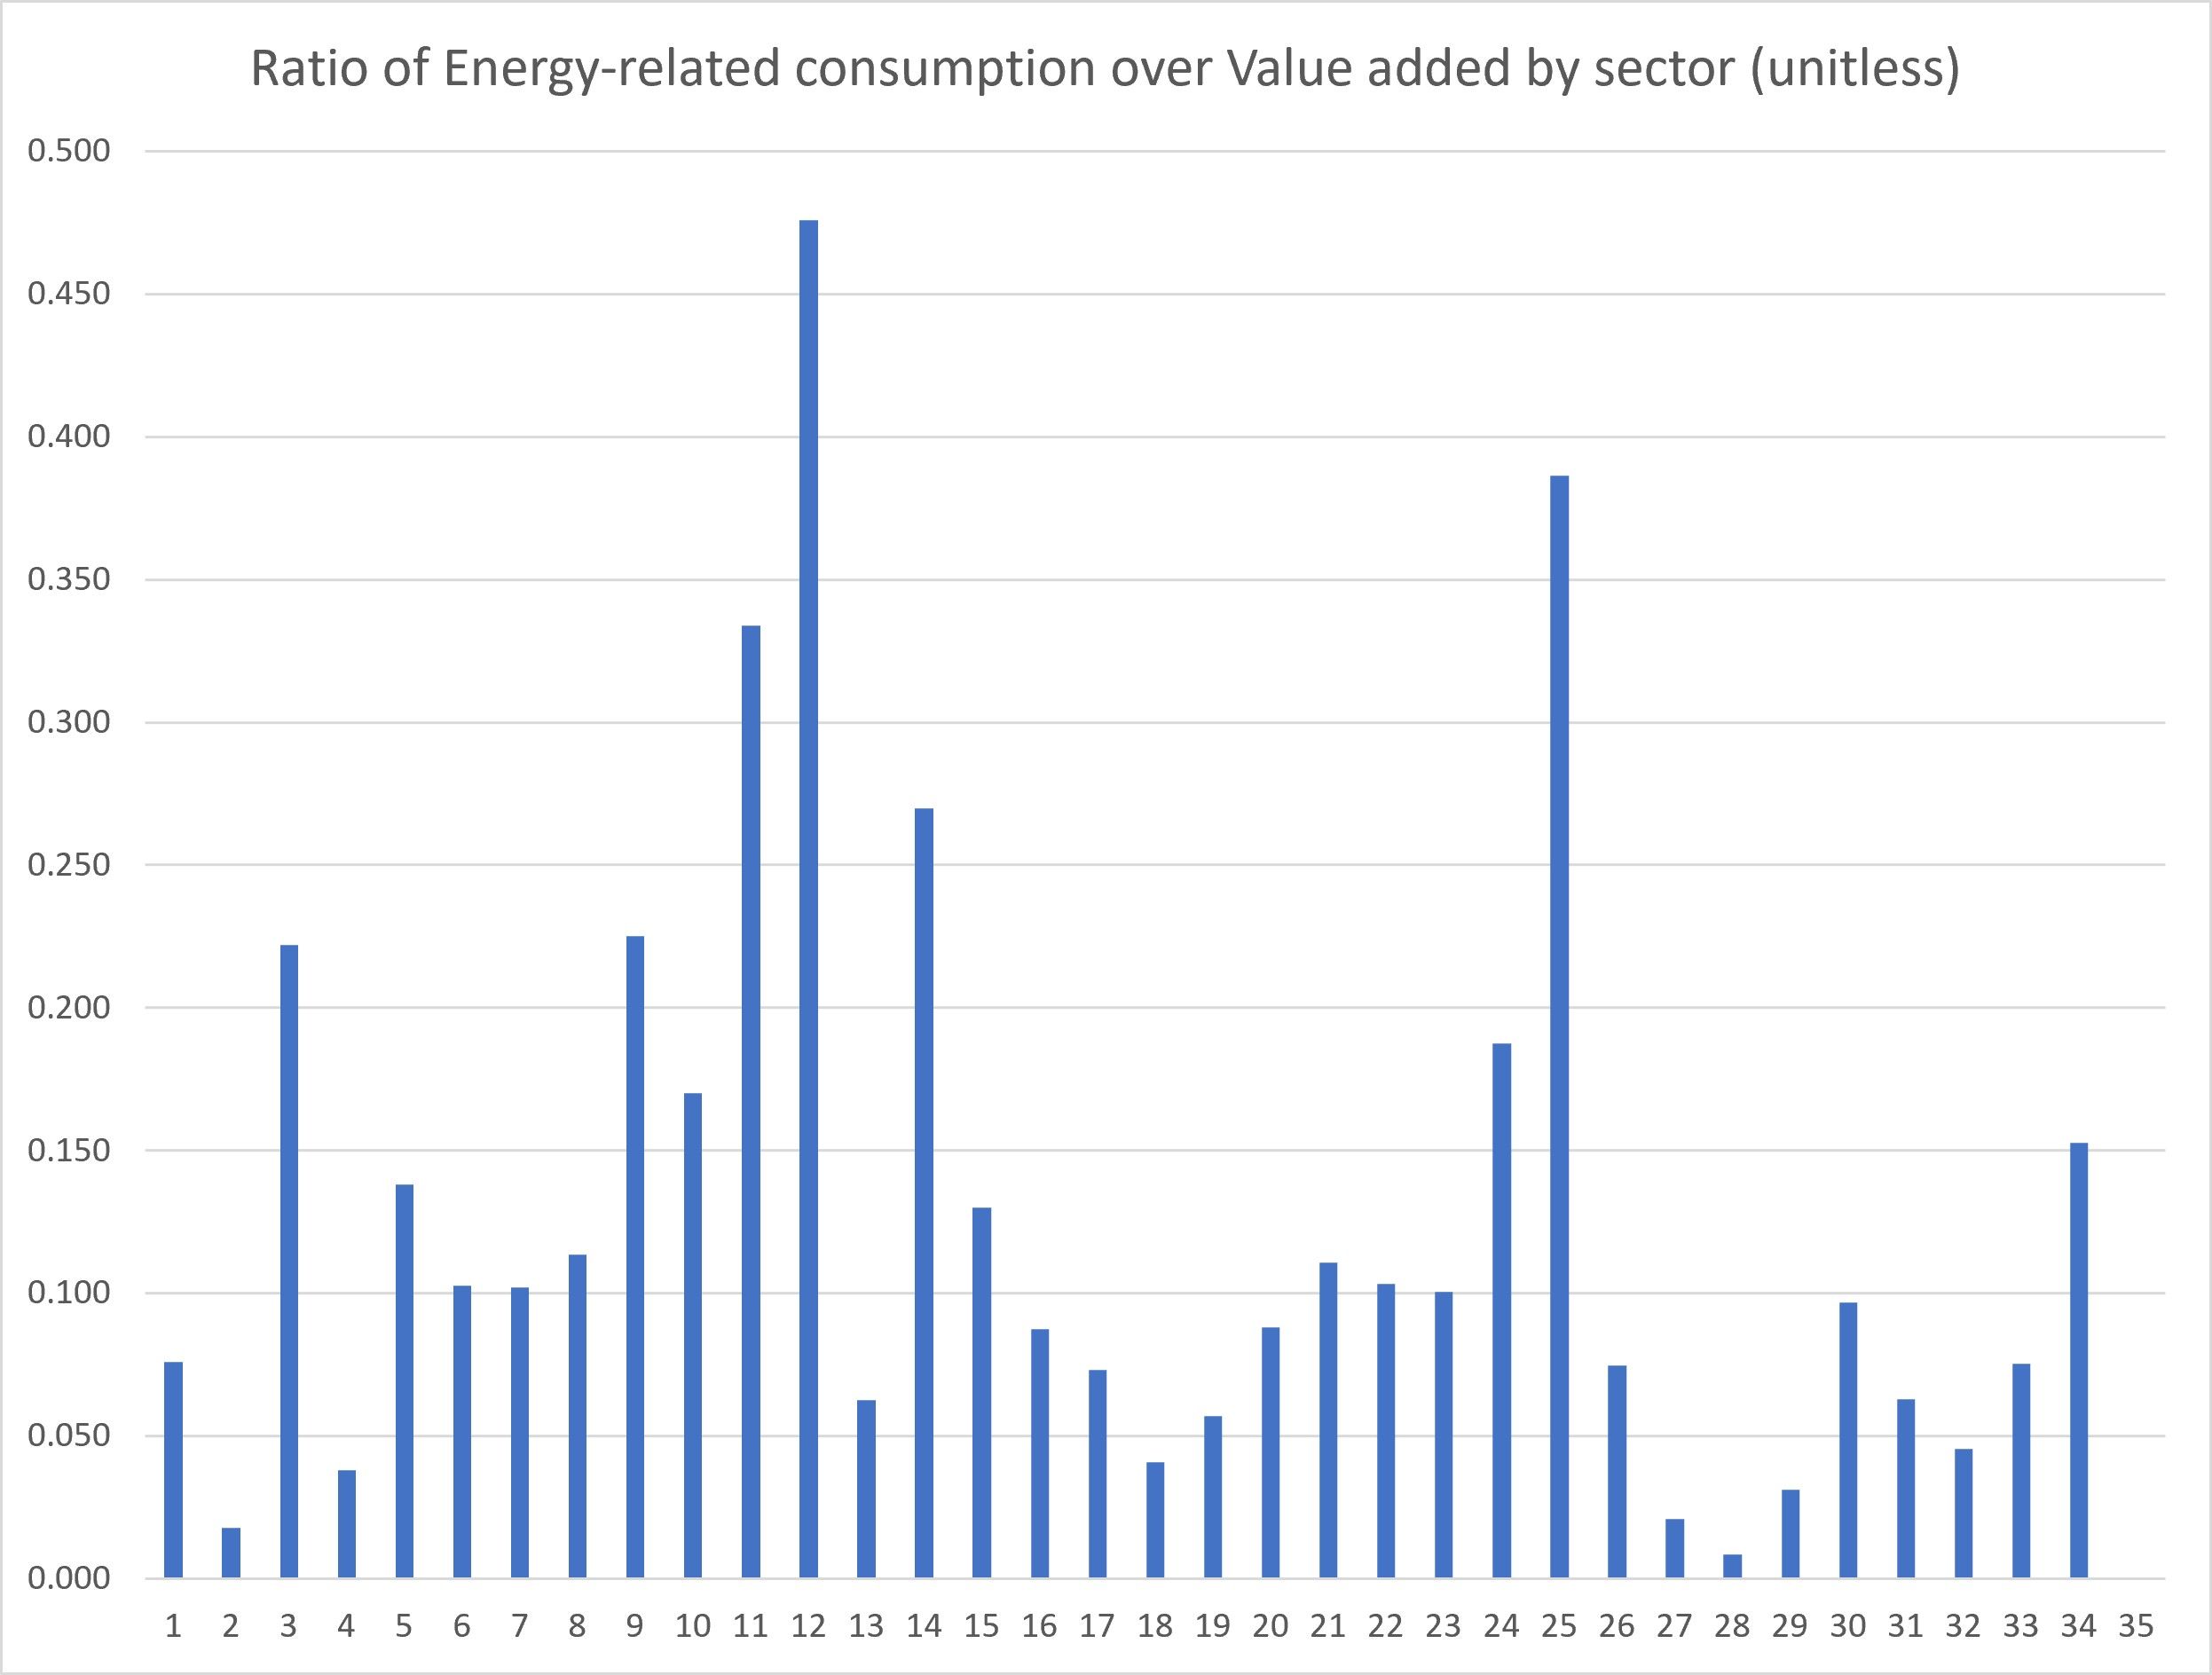
Figure 5: Ratio of GVA over energy-related intermediate consumption by sector. A higher ratio means a sector produces more value added to the economy per unit consumption of sectors 17, 23, 24, and 25.
Carbon metrics: The UAE’s footprint
The UAE’s 2026 Nationally Determined Contributions (NDC) report4 under the United Nations Framework Convention on Climate Change contains estimates of the country’s carbon emissions divided by sector for the baseline year of 2019, as well as descriptions of the actions and policies pledged by the UAE to help reduce the risks of global climate change.
The report states: “The UAE is committed to achieving a 47% reduction in GHG emissions by 2035, compared to the 2019 levels of 196.3 MtCO2e, thereby reducing the anticipated emissions to 103.5 MtCO2e. This target has been established in line with a 1.5 pathway5 in an effort to showcase the UAE’s best efforts, effectively contributing to global mitigation efforts to deliver deep, rapid, and sustained reductions in greenhouse gas emissions by 2035. It is a firm commitment that reaffirms the UAE’s dedication to ensuring that the goal of limiting global warming to 1.5°C remains within reach.”
The UAE NDC report divides annual sectoral emissions as follows:
· Industry: 92.6 million tonnes of CO2e per year
· Buildings: 71 million tonnes of CO2e per year
· Transport: 30.2 million tonnes of CO2e per year
· Waste: 4.8 million tonnes of CO2e per year
· Agriculture: 4.2 million tonnes of CO2e per year
The sum of these five values is 202.8 million tonnes of CO2e per year (gross emissions), which the report then corrects for negative emissions (absorption and sequestration by primarily mangroves and sea grass meadows) of 6.5 million tonnes of CO2e per year to yield the net emissions value of 196.3 million tonnes of CO2e in 2019.
With a population of approximately 11.6 million, the UAE’s baseline gross per capita emissions value is 17.5 tonnes of CO2e per person per year and the net per capita emissions value is 16.9 tonnes of CO2e per person per year. These can be contrasted with the current global average value of 5 tonnes of CO2e per person per year and a science-based target value of less than 2 tonnes of CO2e per person per year.
The overall reduction of 47% by 2035 is further sub-divided as follows:
· 27% reduction in industry emissions, leaving 68 million tonnes of CO2e per year in 2035
· 79% reduction in buildings emissions, leaving 15 million tonnes of CO2e per year in 2035
· 20% reduction in transport emissions, leaving 24.2 million tonnes of CO2e per year in 2035
· 37% reduction in waste emissions, leaving 3 million tonnes of CO2e per year in 2035
· 39% reduction in agriculture emissions, leaving 2.6 million tonnes of CO2e per year in 2035
The total gross emissions value after these reductions is then 112.8 million tonnes of CO2e per year (9.7 tonnes of CO2e per person per year with a population of 11.6 million) and net emissions of 106.3 million tonnes of CO2e per year (9.2 tonnes of CO2e per person per year with a population of 11.6 million).
However, the population is also projected to increase from 11.6 million to 12.9 million by 2035. Correcting for this population growth, the two per capita values for 2035 would be 8.7 tonnes of CO2e per person per year (gross) and 8.3 tonnes of CO2e per person per year (net). All of these per capita values can be compared against the global average and science-based target values of 5 and 2 tonnes of CO2e per person per year.
The NDC report also describes UAE emissions using the Intergovernmental Panel on Climate Change sectoral categories of energy (171.4 million tonnes of CO2e per year), industrial processes and product use (24.4 million tonnes of CO2e per year), waste (4.8 million tonnes of CO2e per year), and agriculture, forestry, and other land use (-4.3 million tonnes of CO2e per year) for the same (net) total of 196.3 million tonnes of CO2e per year. Energy generation accounts for approximately 87% of total emissions, indicating that it is the dominant source of emissions. A significant cause of this high percentage is the high carbon intensity of electricity generation at above 0.0004 tCO2e per kilowatt-hour (more than twice that of the UK) due to the UAE’s extensive reliance on fossil fuels, making decarbonising local energy generation critical to reducing the carbon intensity of the UAE’s economy.
Combining economic and carbon metrics
What conclusions can be drawn from this data with respect to greening the economy and which sectors would serve most effectively as SIPs? There are two broad categories of change necessary for the transition to a green economy. Both of these changes, as well as support for production-based and consumption-based policies, are required to improve environmental performance.
The first change is to improve the efficiency of resource use in sectors that have a high value of carbon emissions and carbon intensity, usually through behaviour change and improvements in material and/or energy efficiency brought about by innovation.
The second is to focus on structural change to transition from an economy where GVA is dominated by high carbon sectors and purchases to one dominated by low carbon sectors and purchases. Structural change requires re-thinking what counts as a preferred economic sector in producing value added. It requires considering simultaneously the current and potential contribution of each sector to GVA, the carbon efficiency with which each sector generates that GVA, and the carbon emissions per unit of energy-related intermediate consumption. And it requires changes in consumer behaviour to increase market demand for lower carbon options in the market.
In transitioning to a green economy through structural change, it is necessary to ensure that the economic efficiency of a new sector is similar to or higher than that of the displaced sector. Moving to a less economically efficient replacement sector might reduce environmental impacts but also reduce the GVA of that sector.
Identifying SIPs in the UAE’s economy
When identifying SIPs, one should look for sectors that contribute significantly to both a country’s carbon footprint and to GVA. They should have a high value of energy-related intermediate and final consumption, but also have a strong potential to reduce emissions through material and energy efficiency improvements while maintaining GVA.
Decarbonising the UAE’s energy grid would have a significant effect on carbon intensity throughout the entire economy, so high priority should be given for sectors involved in energy generation, especially electricity generation, distribution, and transmission.
For example, for material and energy efficiency improvements priority should be given to sectors 2 (mining and quarrying), 9 (chemicals and chemical products), 12 (basic metals and fabricated metals), 21 (retail trade), 25 (air transport), 30 (renting of M&Eq), and F1 (final consumption expenditure by households), supported by production-based and consumption-based policies by government and trade associations. Considering F3 (final consumption expenditure by government) would also be fruitful because it sends a market signal for low carbon building technologies and behaviours.
For material and energy efficiency improvements and mode shifts in transport, priority should be given to sectors 19 as it relates to (retail sale of fuel), 23 (inland transport), 24 (water transport), 25 (air transport), and F1 (with respect to transport choice and related expenditures). F3 (expenditure by government) with respect to transport improvements would also send a market signal for low carbon transport technologies and behaviours as well as investment in public transport.
The opinions expressed in this article are solely those of the author and not Frontier25.